Survey-Grade SLAM: Workflow and Accuracy Analysis for Large Scale Pavement Mapping
Drones grounded? Static scanning too slow? Discover the SLAM workflow I used to map a 1-hectare site with 1.6cm accuracy. No fluff—just real field data, strategic loop closures, and the processing secrets to achieving survey-grade results under a tight deadline.
Paolo Corradeghini
1/30/20265 min read


Can SLAM Deliver Survey-Grade Accuracy? A 1-Hectare Strategic Field Test
We’ve all been there: a one-hectare site to map, a tight deadline, and a location sitting squarely inside a strict No-Fly Zone.
I knew from the start that flying a drone wasn't an option—the weeks required for bureaucratic permits just didn't align with the project's delivery date. But instead of falling back on slower traditional methods, I made a deliberate strategic choice: I left the UAV in the office and put my SLAM (Simultaneous Localization and Mapping) sensor to the test.
In the professional surveying world, there's still a lot of debate about SLAM "drift." Can it actually compete with a static scanner or a GNSS rover for high-density topographic work when the clock is ticking?
Here’s how I planned the mission, the workflow I used to bypass the "no-fly" headache, and the honest results.
Why SLAM? (And why I skipped the alternatives)
In surveying, we choose the tool based on the required "data density vs. time" ratio. For this project—analyzing pavement distress—I needed a continuous "carpet" of points, not just a few dots.
I evaluated the usual suspects and ruled them out:
GNSS RTK: Too sparse. Capturing points every few meters wouldn't reveal the subtle morphology of the surface.
Static Laser Scanner: While the accuracy is top-tier, my current scanner (Trimble SX10) is quite slow in static mode. To cover a whole hectare without gaps, I would have needed dozens of setups, taking far more time than I had available.
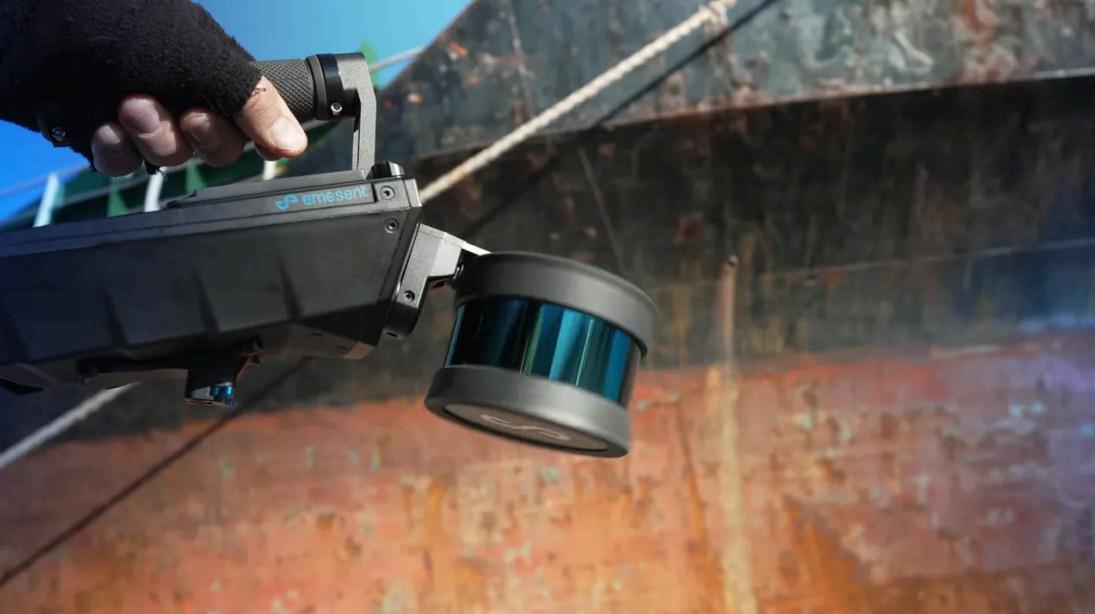
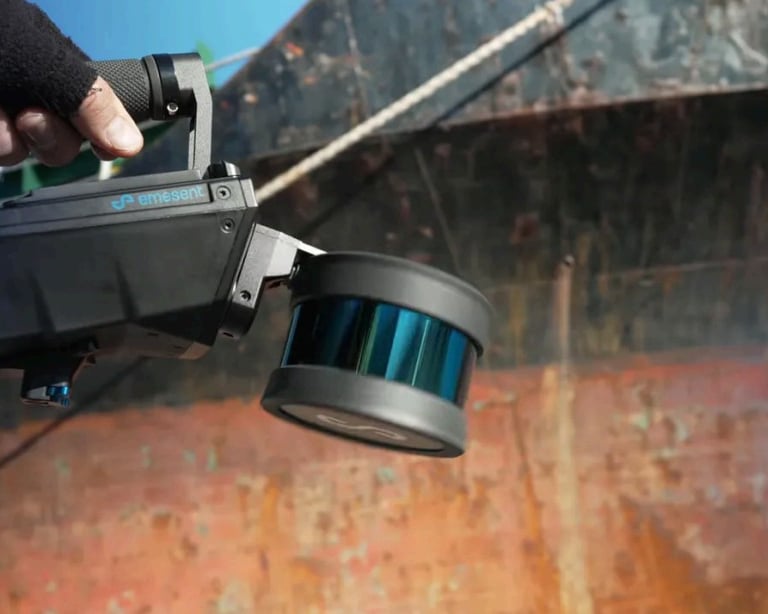
SLAM (Esement Hovermap ST): This was the "sweet spot." It offered the best compromise between high density, accuracy, and—most importantly—speed.
The Foundation: A Robust Control Network
If you want survey-grade results from a SLAM sensor, you cannot rely on the algorithm alone. You need a solid Ground Control Point (GCP) network.
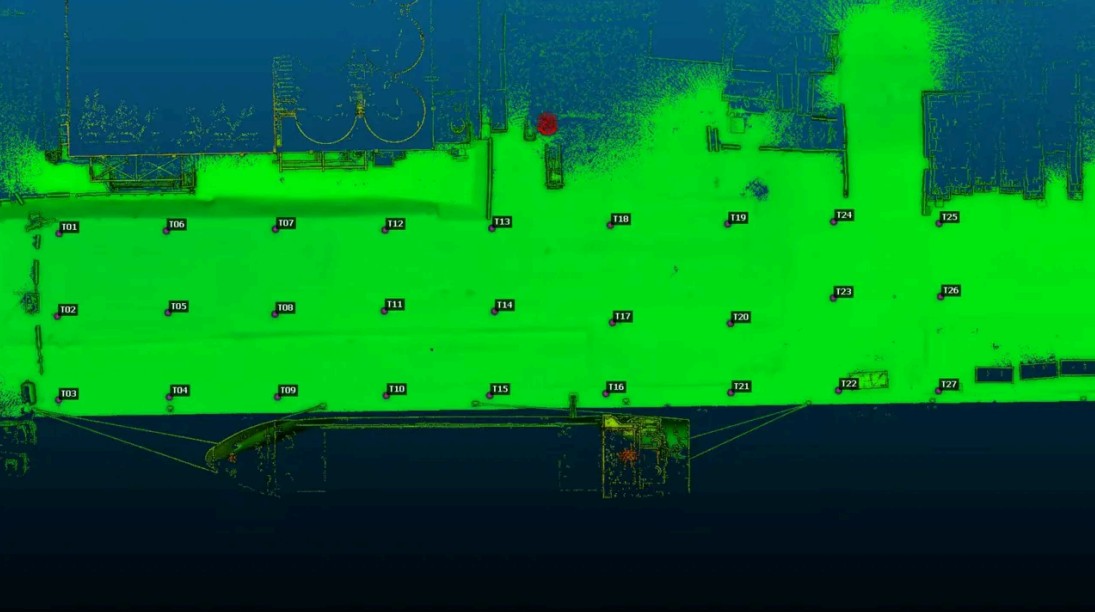
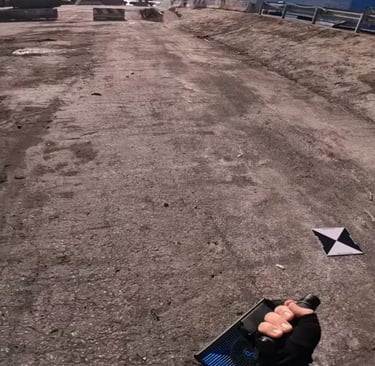
I laid out 30 rigid PVC targets in a regular grid across the 200m x 50m area.
The Workflow: I captured the center of each target using a high-precision GNSS rover connected to a local RTK network, converting them to orthometric heights.
The Strategy: These points weren't just for georeferencing; I split them into Control Points (to constrain the SLAM algorithm) and Independent Checkpoints (to verify the final accuracy).
Never use all your points to "fix" the cloud. Keep a few back as Checkpoints. It’s the only way to be honest about your Error Budget.


Field Craft: The "Art of the Walk"
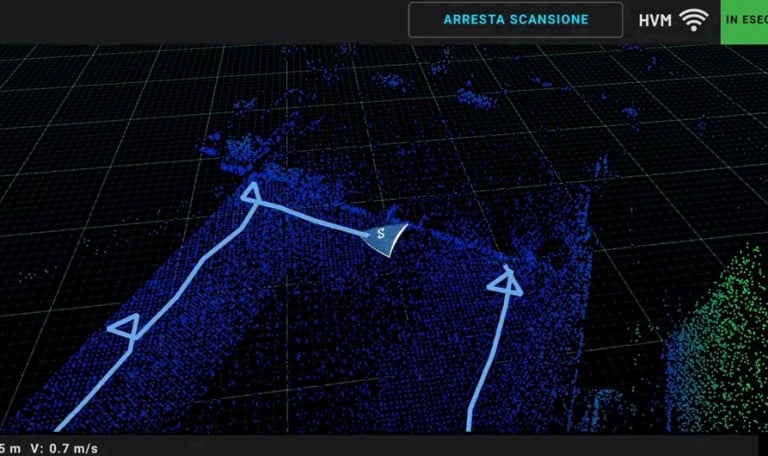
How you move determines the quality of your data. SLAM thrives on Loop Closure. To minimize trajectory drift, I followed a specific walking pattern:
The Perimeter Loop: A large outer ring to "lock" the boundaries of the survey.
The Zig-Zag: Crossing the interior in diagonal paths to ensure I passed over targets multiple times, creating a "triangulated" coverage.
The "Target Dance": When reaching a GCP, I circled it at a 1.5m distance while pointing the sensor directly at the target. This ensures the point cloud density is high enough to easily identify the center during post-processing.
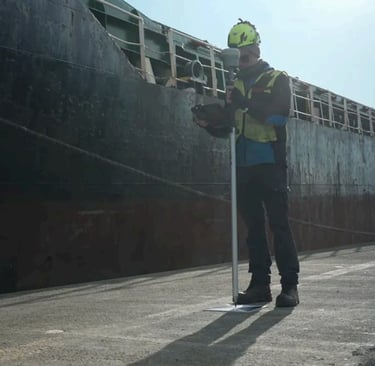
Operational Detail: I carried the scanner by hand, pointing it forward and down while moving my arm slightly from side to side. This maximizes ground density—critical when your main objective is the pavement.


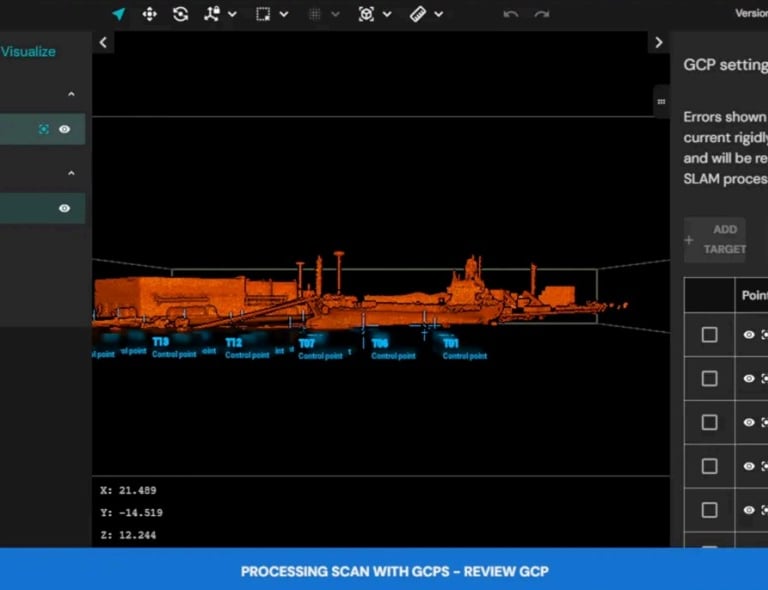
Post-Processing: Optimization vs. Rigid Alignment
This is where many SLAM projects fail.
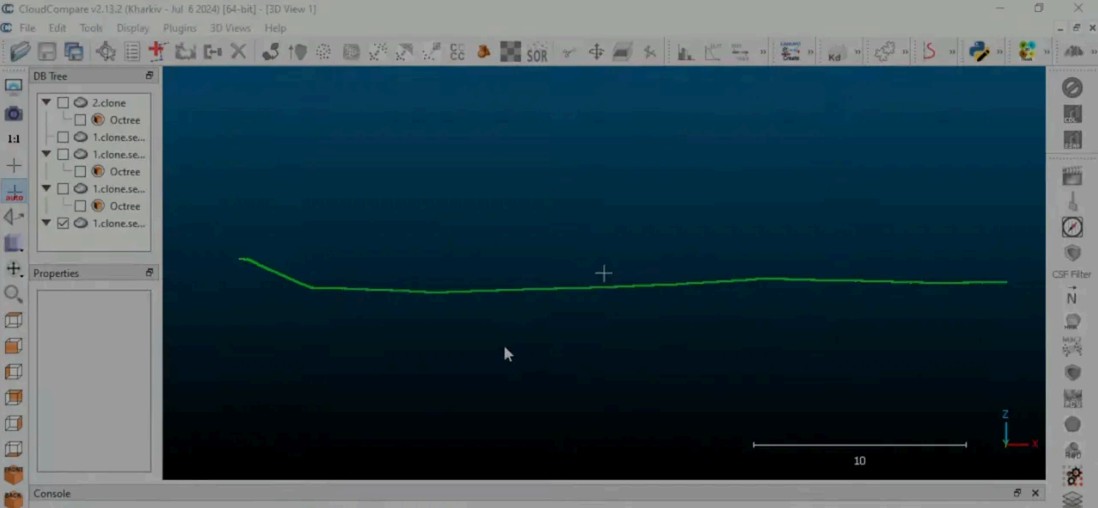
If you just take a raw SLAM cloud and try to "fit" it to your points using a simple rigid transformation (like in CloudCompare), you won't fix the internal trajectory warping.
I used Emesent Aura for the processing.
The software doesn't just move the cloud; it optimizes the entire trajectory based on the GCPs. It corrects micro-drifts and local deformations. Without this sophisticated adjustment, you aren't doing topography; you're just making a pretty picture.

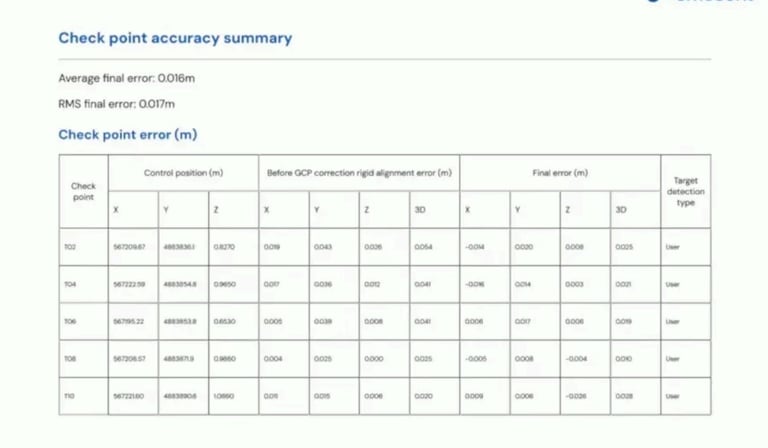
The Results: By the Numbers
After 2 hours of processing (which took about 4x the actual time spent on-site), the accuracy report confirmed my strategy:
Mean Error on Checkpoints: ~1.6 cm (0.05 ft)
RMS Error: ~1.7 cm (0.055 ft)
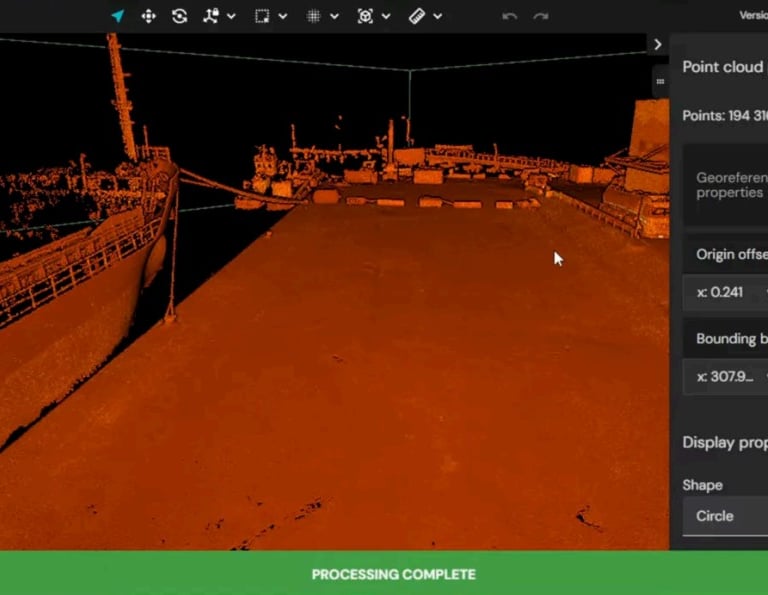
Point Density: Roughly 11,000 points per square meter (analyzed in a 1x1m sample).
The noise level was sub-centimeter for most of the area, with only a few isolated spikes around 2 cm. This provided a clean, dense dataset ready for extracting cross-sections and contour maps.


4 Practical Tips for Your Next SLAM Survey
Design the Network First: Don't just throw targets down. Plan a regular distribution with a mix of GCPs and Checkpoints before you start walking.
Go Hand-held for Ground Detail: If the pavement is your target, carrying the scanner gives you more control over the sensor's orientation than a backpack.
Monitor in Real-Time: Use an app to verify coverage while you're still on-site. Don't wait until you're back at the office to find a "hole" in your data.
Targets are Non-Negotiable: Even with SLAM+GNSS integrated systems, physical targets on the ground are your only true insurance policy for verifiable accuracy.
Final Thought
So, can you do topography with a SLAM?
Yes, but it’s not a "toy."
It requires a high-performance sensor, a rigorous field methodology, and robust processing software.
In this case, it allowed me to bypass a bureaucratic nightmare and deliver a high-quality survey in a fraction of the time.
Watch the Field Test in Action
Want to see this workflow and the sensor in action? This post is a deep dive into a case study I recently shared on my YouTube channel. The video is in Italian, but I’ve made sure to include subtitles so you can follow every step of the field operations and data processing. You can watch it right here:
